Quickstart with Leaspy
This example shows how to quickly use Leaspy.
Comprehensive example
We first load synthetic data in a long format to get of a grasp of longitudinal data:
from leaspy.datasets import load_dataset

alzheimer_df = load_dataset("alzheimer")
print(alzheimer_df.columns)
alzheimer_df = alzheimer_df[["MMSE", "RAVLT", "FAQ", "FDG PET"]]
print(alzheimer_df.head())
Index(['E-Cog Subject', 'E-Cog Study-partner', 'MMSE', 'RAVLT', 'FAQ',
       'FDG PET', 'Hippocampus volume ratio'],
      dtype='object')
                      MMSE     RAVLT       FAQ   FDG PET
ID     TIME
GS-001 73.973183  0.111998  0.510524  0.178827  0.454605
       74.573181  0.029991  0.749223  0.181327  0.450064
       75.173180  0.121922  0.779680  0.026179  0.662006
       75.773186  0.092102  0.649391  0.156153  0.585949
       75.973183  0.203874  0.612311  0.320484  0.634809
The data correspond to repeated visits (TIME index) of different participants (ID index).
Each visit corresponds to the measurement of 4 different outcomes : the MMSE, the RAVLT, the FAQ and the FDG PET.
If plotted, the data would look like the following:
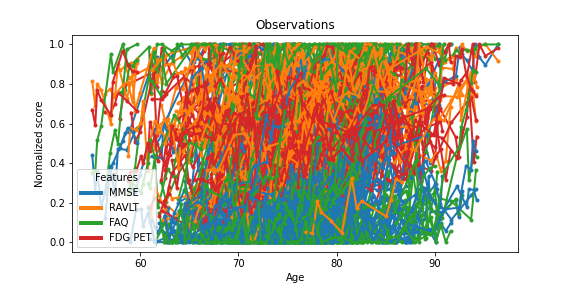
Where each color corresponds to a variable, and the connected dots corresponds to the repeated visits of a single participant.
Not very engaging, right ? To go a step further, let’s first encapsulate the data into the main Data container:
from leaspy.io.data import Data, Dataset

data = Data.from_dataframe(alzheimer_df)
dataset = Dataset(data)
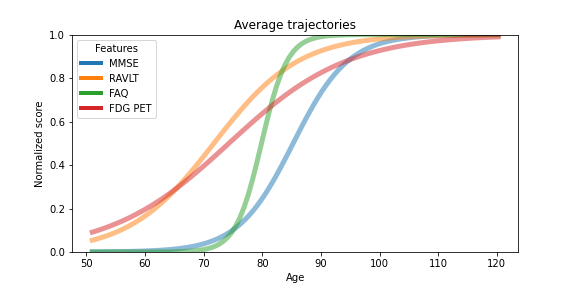
Leaspy core functionality is to estimate the group-average trajectory of the different variables that are measured in a population. Clinical scores often have a ceiling and a floor effect, so let’s initialize a multivariate logistic model:
from leaspy.models import LogisticModel

model = LogisticModel(name="test-model", source_dimension=2)
As well as the algorithm needed to estimate the group-average trajectory:
from leaspy.algo import AlgorithmSettings, algorithm_factory

fit_settings = AlgorithmSettings(
    "mcmc_saem", seed=42, n_iter=100, progress_bar=False, save_periodicity=None
)
algorithm = algorithm_factory(fit_settings)
model.initialize(dataset, fit_settings.model_initialization_method)
algorithm.run(model, dataset)
/home/docs/checkouts/readthedocs.org/user_builds/leaspy/checkouts/dev/src/leaspy/algo/settings.py:360: UserWarning: The parameters ['save_periodicity'] were not present by default and are likely to be unsupported.
  warnings.warn(
/home/docs/checkouts/readthedocs.org/user_builds/leaspy/checkouts/dev/src/leaspy/algo/settings.py:76: UserWarning: Outputs will be saved in '_outputs' relative to the current working directory
  self._create_root_folder(settings)
/home/docs/checkouts/readthedocs.org/user_builds/leaspy/checkouts/dev/src/leaspy/algo/settings.py:76: UserWarning: The logs path you provided (/home/docs/checkouts/readthedocs.org/user_builds/leaspy/checkouts/dev/docs/auto_examples/_outputs) does not exist. Needed paths will be created (and their parents if needed).
  self._create_root_folder(settings)
==> Setting seed to 42
/home/docs/checkouts/readthedocs.org/user_builds/leaspy/envs/dev/lib/python3.11/site-packages/torch/__init__.py:1240: UserWarning: torch.set_default_tensor_type() is deprecated as of PyTorch 2.1, please use torch.set_default_dtype() and torch.set_default_device() as alternatives. (Triggered internally at /pytorch/torch/csrc/tensor/python_tensor.cpp:434.)
  _C._set_default_tensor_type(t)
Fit with `AlgorithmName.FIT_MCMC_SAEM` took: 6s
<leaspy.variables.state.State at 0x7c1b4b549dd0>
If we were to plot the measured average progression of the variables, see started example notebook for details, it would look like the following:
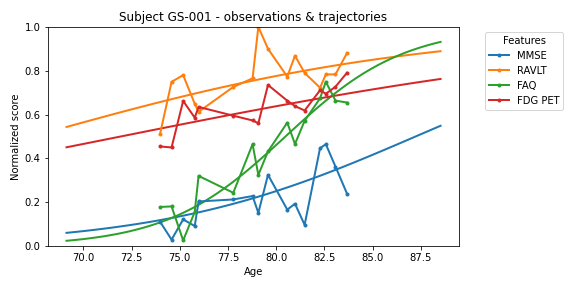
We can also derive the individual trajectory of each subject.
To do this, we use a personalization algorithm called scipy_minimize:
personalize_settings = AlgorithmSettings("scipy_minimize", seed=0, progress_bar=False)
algorithm = algorithm_factory(personalize_settings)
individual_parameters = algorithm.run(model, dataset)
print(individual_parameters.to_dataframe())
==> Setting seed to 0
/home/docs/checkouts/readthedocs.org/user_builds/leaspy/checkouts/dev/src/leaspy/algo/personalize/scipy_minimize.py:626: UserWarning: In `scipy_minimize` you requested `use_jacobian=True` but it is not implemented in your model test-model. Falling back to `use_jacobian=False`...
  warnings.warn(
Personalize with `AlgorithmName.PERSONALIZE_SCIPY_MINIMIZE` took: 38s
        sources_0  sources_1        tau        xi
ID
GS-001   0.519938   0.350398  78.325272 -0.347083
GS-002  -0.727231  -0.153210  77.355064 -0.584110
GS-003  -0.231240  -0.893911  77.242165  0.068400
GS-004   0.139597  -0.115736  78.953514  0.428237
GS-005   0.236304  -1.879540  85.565277 -0.010133
...           ...        ...        ...       ...
GS-196   0.479973  -1.056671  73.667122  0.313890
GS-197   0.532045   1.018136  81.426926 -0.557547
GS-198  -0.119706  -0.098844  84.578064  0.161188
GS-199  -0.015778  -2.901355  94.292450 -0.156172
GS-200   0.926342  -0.821031  77.081177  0.782181

[200 rows x 4 columns]
Plotting the input participant data against its personalization would give the following, see started example notebook for details.
Using my own data
Data format
Leaspy uses its own data container. To use it properly, you need to provide a csv file or a pandas.DataFrame in the right format: longitudinal data in a long format. Let’s have a look at the data used in the previous example:
print(alzheimer_df.head())
                      MMSE     RAVLT       FAQ   FDG PET
ID     TIME
GS-001 73.973183  0.111998  0.510524  0.178827  0.454605
       74.573181  0.029991  0.749223  0.181327  0.450064
       75.173180  0.121922  0.779680  0.026179  0.662006
       75.773186  0.092102  0.649391  0.156153  0.585949
       75.973183  0.203874  0.612311  0.320484  0.634809
Warning
You MUST have ID and TIME, either in index or in the columns. The other columns must be the observed variables (also named features or endpoints). In this fashion, you have one column per feature and one line per visit.
Data scale & constraints
Warning
Leaspy uses linear and logistic models.
The features MUST be increasing with time.
For the logistic model, you need to rescale your data between 0 and 1.
Missing data
Leaspy automatically handles missing data as long as they are encoded as nan in your pandas.DataFrame, or as empty values in your csv file.
Going further
You can check the user_guide and the full API documentation.
You can also dive into the examples.
The Disease Progression Modelling website also hosts a mathematical introduction and tutorials for Leaspy.